Table Generator Help
Overview
Table Generators are tools that allow users to access aggregate GVSU information over the internet. Using a table generator, getting the information you want is a simple drag-and drop process, but the tool has the flexibility to help you get exactly the data you need without a lot of unnecessary information.
We currently have four table generator tools:
- the Degree Table Generator accesses data about GVSU degrees granted and their recipients*;
- the Enrollment Table Generator accesses data about GVSU students*;
- the Faculty Table Generator accesses data about GVSU faculty members;
- the Section Table Generator accesses data about GVSU courses and course sections;
* - Access to the Degree and Enrollment Table Generators is restricted to GVSU employees to comply with federal rules on the confidentiality of student records.
Examples and explanations in the remainder of this document are taken from various Table Generators, but the functionalities described apply equally to each one.
The table generator interface consists of two principal parts:
- A few dozen colored boxes which represent the characteristics that can appear in your table ("Pods");
- A gray table diagram (at the bottom of the page), with white boxes representing the ways the data can appear in the table ("Slots").
For example, (in the Enrollment Table Generator) if you put the Class pod into one of the of the slots labeled "Row", it would specify a table that looks something like this:
| Headcount | ||
|---|---|---|
| Class | ||
| FRESHMAN | 4093 | |
| SOPHOMORE | 4281 | |
| JUNIOR | 3982 | |
| SENIOR | 6037 | |
| MASTERS | 3670 | |
| Total | 22063 | |
The table shows the number of students by class, with the classifications listed down the left side of the table. (You specified Class as a "Row" variable, so the table has a row for each class.) If you put Class in one of the slots labeled "Column" instead, the table would look like the following, with the classifications listed across the top of the table:
| Class | FRESHMAN | SOPHOMORE | JUNIOR | SENIOR | MASTERS | Total | |
|---|---|---|---|---|---|---|---|
| Total | 4093 | 4281 | 3982 | 6037 | 3670 | 22063 | |
When you've designed your table the way you want it to appear, click the "Submit Request" button, and your table will be created exactly as you've requested, and you can read it in your browser, open it up as a spreadsheet, print it, or go back and modify the specifications.
The parts of the window:
There are 3 general parts to the table generator page:
|
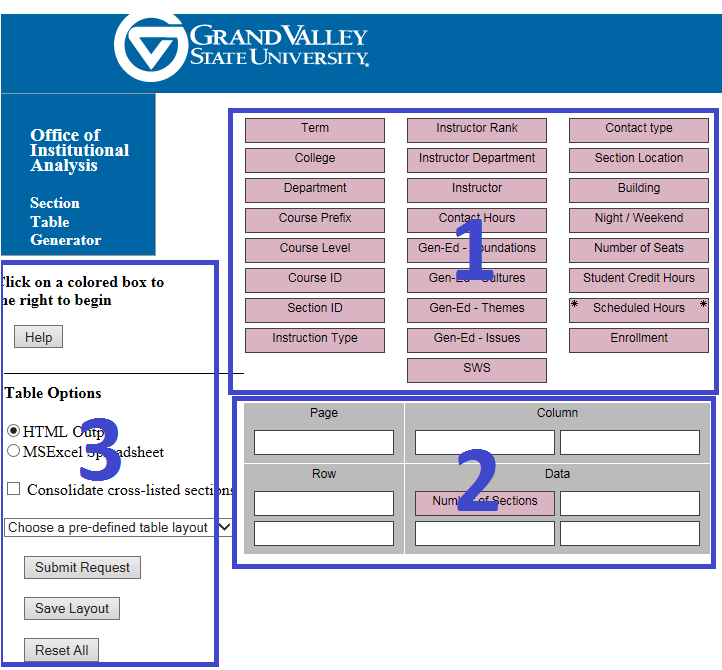 |
How to move a pod:
Unless you're using a touchscreen device, the easiest way to move a pod is just to click it and drag it to where you want it to be. Use the left mouse button to click and drag the pod, and release the button over the desired location to drop the pod. Pods can only be dropped in appropriate slots or in their "home" location. If you drop a pod anywhere else on the page, it will return to its "home" location. The home location is the space reserved for the pod in the list of available pods (the upper 2/3 of the page).
You can also move a pod by using its options menu. Left click (or tap) on the pod to view the list of actions you can take with the variable. Among the options listed will be a list of places where the pod can be moved. These options will include some, but not all, of the following:
- Make it a COLUMN variable -- puts the pod in the highest available "Column" slot.
- Make it a ROW variable -- puts the pod in the highest available "Row" slot.
- Make it a PAGE variable -- puts the pod in the "Page" slot.
- Make it a DATA variable -- puts the pod in the highest available "Data" slot.
- Promote it -- Moves the variable to the next higher slot within the same table dimension. For example, a pod in the second "Row" slot can be promoted to the first "Row" slot.
- Demote it -- Moves the variable to the next lower slot within the same table dimension. For example, a pod in the first "Row" slot can be demoted to the second "Row" slot.
- Remove it from the table -- sends the pod back to its "home" location.
For information about the difference between higher and lower slots within a table dimension, see the section on slot order below.
If you move a pod (either by drag-and-drop or the pod options menu) to a slot that is already occupied by another pod, the pods will trade places, with the displaced pod going to the place where the pod you moved started. (If the pod you moved was in its "home" location, the displaced pod will go to its own home, not to the exact spot where the new pod was located.) If the displaced pod is not allowed to occupy the slot from which you moved the new pod, the displaced pod will go to its home location instead.
Other things you can do with a pod:
In addition to moving a pod into, around in, or out of the table, there are several other useful actions available from the pod options menu. Not all options are available for all pods, and some options are context-sensitive -- they only appear on the options menu when the situation makes them appropriate.
The following actions may be available from the options menu:
- See more details about it in the data dictionary -- Opens this help page to the Data Dictionary entry for the variable. The data dictionary contains more extensive information about the variable, its values, and its formatting.
- Control the way values will be grouped in the table -- Opens the Formatting Window for the variable. The formatting window allows you to customize the way values of certain variables will be grouped in your table. This option is only available for selected variables and only when those variables are in a "Row", "Column", or "Page" slot.
- Allow duplication of records for [students] with multiple values -- Set the duplication flag for this variable. See Duplication for details. This option is only available for selected variables and only when those variables are in a "Row", "Column", or "Page" slot. (The word "students" is replaced with "faculty members" or "graduates" as appropriate.)
- Disable duplication of records for [students] with multiple values -- Remove the duplication flag for this variable. See Duplication for details. This option is only available for selected variables and only when those variables are in a "Row", "Column", or "Page" slot and duplication has previously been enabled. (The word "students" is replaced with "faculty members" or "graduates" as appropriate.)
- Use it for record selection -- Opens the Record Selection Window for the variable. The selection window allows you to limit the population included in your table to those students (or faculty members, course sections, or degrees) with certain values of the variable.
- Clear its record selection setting -- Removes any current selection parameters for the variable. This option only appears if record selection parameters have previously been set.
- Do nothing -- Closes the option window without making any changes. (Clicking the "X" at the upper right of the options window has the same effect.)
The parts of the table (the slots)
A table can show your information in up to four different ways: across the columns of the table; down the table in rows; broken up into many different table pages; or as the data element summarized within the table's individual cells. The following examples (from the Section Table Generator) illustrate the 4 types:
Data = Number of SectionsCourse Prefix = FRE
|
In the tables to the left, Course Level is laid out as a "Column" variable, while Instructor Rank is shown as a "Row" variable. Course Prefix is a "Page" variable here, meaning that a separate table is created for each subject area. Finally, the "Data" element for these tables is Number of Sections , so each cell shows the number of sections with the characteristics described by the "Column", "Row", and "Page" variables. A table with two data elements, Number of Sections and Census Credit Hours, is shown below. In it, the data elements are arrayed horizontally, as if they were values of a "Column" variable. | |||||||||||||||||||||||||||||||||||||||||||||||
Data = Number of SectionsCourse Prefix = GER
|
Course Prefix = FRE
|
|||||||||||||||||||||||||||||||||||||||||||||||
The Table Generator allows you to select up to 2 column variables and up to 2 row variables. You can select one page variable and up to 4 data elements. If you select more than one data element, a new pod, Data Variables, will appear in your table diagram. This pod is a placeholder that controls how the multiple data variables will be dispayed in your table. You can move it around in your table (to other "Column", "Row", or "Page" slots), but the only way to remove it from the table is to remove "Data" variables until only one "Data" slot is occupied, at which time the Data Variables pod will disappear. The Data Variables pod will initially be placed in an empty "Column", "Row", or "Page" slot if possible. If all of those slots are filled, Data Variables will displace the pod in the second "Column" slot.
The following tables illustrate effects of different placements of Data Variables:
- Data Variables in a "Column" slot
Course Prefix = FRE
Data Type Number of Sections Census Credit Hours Instructor Rank Assistant Professor 10 446 Associate Professor 3 142 Total 13 588 - Data Variables in a "Row" slot
Course Prefix = FRE
Instructor Rank Assistant Professor Associate Professor Total Data Type Number of Sections 10 3 13 Census Credit Hours 446 142 588 - Data Variables in the "Page" slot
Data Type = Number of Sections
Instructor Rank Assistant Professor Associate Professor Professor Total Course Prefix FRE 10 3 13 GER 3 6 9 Total 13 3 6 22
Data Type = Census Credit Hours
Instructor Rank Assistant Professor Associate Professor Professor Total Course Prefix FRE 446 142 588 GER 151 183 334 Total 597 142 183 922
The significance of order within table dimensions
With both column and row elements, you have the option of nesting variables. Nesting a variable means that the different levels of the second variable will be shown for each level of the first variable. For the "Column" slots, a variable in the right-hand slot will be nested within the variable in the left-hand slot. For "Row" variables, the variable in the lower pod is nested within the variable in the upper slot. In both cases, if there is only one variable specified for that particular dimension (i.e. only one "Column" variable or only one "Row" variable), it makes no difference which of the two slots it occupies.
The tables below give examples of nested "Row" variables. In the first table, Course Level values are nested within Night/Weekend categories, while the second table has Night/Weekend nested within Course Level. The same data are displayed either way, although the presentation differs slightly.
|
| ||||||||||||||||||||||||||||||||||||||||||||||||||||||||||||||||||||||||||||||||
For "Data" variables, slot order only affects the order in which the types of summary data appear. For example, the first Enrollment Table Generator table below has Headcount before Attempted Hours, while the second table has their positions reversed.
|
| ||||||||||||||||||||||||||||||||||||||||||
| Note that the four data slots are in "row-major" order, meaning that any variables in the two top data slots will appear before any variables in the lower data slots. | |||||||||||||||||||||||||||||||||||||||||||
Table Layout Hints
As a rule, you should make your tables as uncomplicated as possible. The more variables you add to the table, the larger and more unwieldy your table becomes. At the extremes, your table can become so large that it slows your web browser to an apparent halt. Here are some hints for laying out tables that will give you the information you want without tons of unwanted data:- Only use variables that you actually need.
- Use record selection to trim the amount of data your table presents.
- If you use variables with lots of different values (like Major, Department, or Course ID), use them as row variables, since row variables take up much less space on your screen or page than column or page variables.
Record selection:
By using the pods' Record Selection windows, you can modify your table request to only include information about the students (or faculty members, degrees, or courses) that are of interest to you. For example, you can use the Faculty Table Generator to create a table of only Engineering faculty, or only tenured faculty members, or female Associate Professors.
You can access the Record Selection window for a variable by choosing "Use it for record selection" from the pod's options menu. Note that a variable does not need to be part of your table layout to be used for record selection.
The Record Selection menu will take one of three forms. For continuous variables, you are asked to designate a range of values to include (or exclude); for most variables with discrete values you are given a selection list of possible values; for some variable with many possible text values, you can give a text string to match, with wildcards if necessary.
Selecting a range:
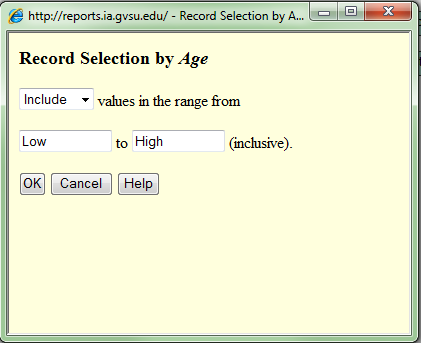
To select a range of values, simply enter the lower and upper bounds of the range in the appropriate boxes in the selection window. The default contents of the text boxes, "Low" and "High", are special values which can be used to create open-ended ranges. For example, "Low" to "500" is how you would select all values less than or equal to 500. (Note that selection ranges include both their lower and upper bounds.)
You also have the option of excluding the values in the range (and keeping all others). To do this, select "Exclude" instead of "Include" in the first selection box.Selecting specific values:
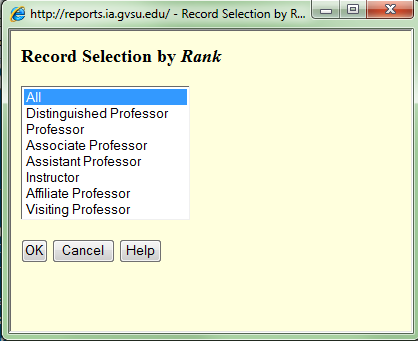
To make a single selection from the drop-down list, just click the desired value. To make multiple selections, select the first value by clicking it, then make subsequent selections by holding down the Ctrl key and clicking the additional values.
Text string matching
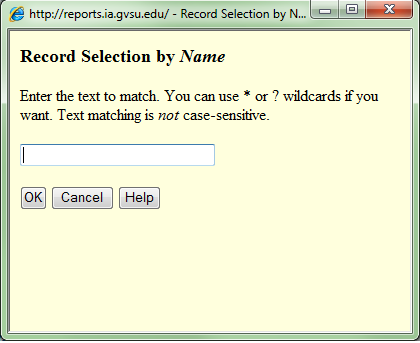
Type as much of the text value as you want. Use the ? and * wildcard characters to represent unknown characters.
- ? represents any single letter, numeral, or symbol (including space).
- * represents 0 or more letters, numerals, or symbols (including spaces).
Examples:
All of the text-matching selection windows are case-insensitive, meaning that capital letters will be matched to their lower-case counterparts and vice versa. Additional information about text-matching is available in the appropriate data dictionary entries.Typing this... ... might yield these Smith, C Smith, Calvin
Smith, Carl
Smith, Carla
Smith, Carol
Smith, Charles
Smith, Cheryl
Smith, CristineSmith, Ch Smith, Charles
Smith, CherylSmith, C*r Smith, Carl
Smith, Carla
Smith, Carol
Smith, Charles
Smith, Cheryl
Smith, CristineSmith, C?r Smith, Carl
Smith, Carla
Smith, CarolSmith, Carl Smith, Carl
Smith, CarlaSmith, Carl? Smith, Carla
Applying your selections
When you have designated your selection criteria, click the "Done" button. The pod for which you just created selection criteria will now have asterisks (*) in its upper corners as a visual reminder that you have made exclusions.
If you specify selection criteria for more than one variable, those criteria are compounded -- records must meet all selection criteria to be included in the table. For example, if you select "Associate Professor" for Rank and "Female' for Gender you will get data only for faculty members who are female AND hold Associate Professor rank. (In logic terminology, you're making "and" operations, not "or" operations.) With these selections you could get the following simple trend breakdown for female Associate Professors:
| College | Academic Year | 2002-03 | 2012-13 | Total |
|---|---|---|---|---|
| COLLEGE OF COMMUNITY & PUBLIC SERVICE | 2 | 12 | 14 | |
| COLLEGE OF EDUCATION | 5 | 13 | 18 | |
| COLLEGE OF HEALTH PROFESSIONS | 5 | 5 | ||
| COLLEGE OF INTERDISCIPLINARY STUDIES | 5 | 5 | ||
| COLLEGE OF LIBERAL ARTS & SCIENCES | 61 | 91 | 152 | |
| KIRKHOF COLLEGE OF NURSING | 10 | 12 | 22 | |
| PADNOS COLLEGE OF ENGINEERING & COMPUTING | 2 | 2 | ||
| SEIDMAN COLLEGE OF BUSINESS | 5 | 14 | 19 | |
| UNIVERSITY LIBRARIES | 5 | 3 | 8 | |
| Total | 88 | 157 | 245 | |
To remind you that your table shows a subset of the GVSU faculty rather than the entire population, there will be a small extra table at the end of each report that summarizes the selection criteria you submitted. For the example above, the summary table looks like this:
Summary of Record Selection Criteria
| Characteristic | Selected Values |
|---|---|
| Academic Year | 2012-13 | 2002-03 |
| Rank | Associate Professor |
| Gender | FEMALE |
About term (semester) or year selection
You can generate tables with GVSU data from a single semester or from multiple semesters. By default, tables will generally include data from the most recent relevant semester. Degree Table Generator tables default to the most recent complete academic year.
The record selection windows for Term or Academic Year include an option for "Most Recent Term" (or Year). This allows stored layouts to access updated data as it becomes available (e.g. a query that asks for Fall 2012 enrollment will always yield Fall 2012 figures, but a query for "Most Recent Term" will not.)
Note that selecting more than one term will not automatically result in a table that shows trend data. You must also include Term as a table element (That is, the pod should be in the table diagram). If you use multiple terms' data, but do not specify Term as a table variable, data will be aggregated across terms. It is not possible to unduplicate by term (that is, to count how may individuals meet certain criteria in at least one term in a multi-term range). If you need unduplicated counts for a multi-semester period, please contact the Office of Institutional Analysis directly.
Formatting variables:
With many variables, you have a choice about how the values will be categorized in your table. This allows you much more flexibility to create the table precisely the way you need it. For example, the default Degree Table Generator categories for age include the range "25-29". However, if you need to know how many bachelor's degree recipients were over 25 (i.e. 26 or older), the default doesn't quite work. You can use the formatting window for Age to tell the table generator to use a single cutpoint at 26, and your table will have just two age categories -- representing "Under 26" and "26 and Older".
There are two types of formatting windows you may encounter. A few variables have a limited number of formatting options available, and their formatting windows present a drop-down list with the choices. Following is a list of those variables and links to their data dictionary entries, where you can find specific details about formatting options.
|
|
|
|
The other type of formatting window appears for continous variables -- that is, variables like Age or Attempted Hours that can take any value within an expected range. For these variables a default rule for separating the values into categories has been assigned (these are described in the variables' data dictionary entries), but you can apply a customized formatting rule if you want.
The custom formatting rule for a continuous variable can take either of two forms: a list of specific cutpoints, or an interval for equal-size ranges.
- To designate specific cutpoints, simply type the cutpoints in ascending order, separating the values with commas. For example if you want to see data about three groups of students -- those taking less than 12 hours, those taking 12 to 17 hours, and those taking 18 or more hours -- you would type "12,18" (without the quotation marks) in the formatting window for Attempted Hours.
- To designate intervals, you use the form "byRatL", where R is the size of each range and L is the low end of the lowest interval. For example "by10at15" specifies that each of the categories should span 10 units (let's say years, in the case of Age), and the lowest 10-year range should start at 15. This would result in categories like 15-24, 25-34, 35-44, etc. Note that any values that are less than L will still be reported in a catch-all category labeled "0-14". Either R or L or both can be a negative number or a decimal, but they cannot contain letters, special symbols (other than "-" and "."), or spaces. (Quotation marks in these instructions are for clarity -- you should not type them in the formatting window.)
In cases where the university does not know (or did not know at the time the data were captured) the value for a variable for one or more records, the missing data will be reported as a separate category, typically labeled with a period (.).
Record duplication:
Enabling duplication by a variable in your table is a way of acknowledging that some characteristics are not restricted to "one to a customer." For example, a student can have more than one major at a time. If you specify an Enrollment Table Generator table showing students'majors but don't enable duplication, you'll get a tabulation of students' primary majors, and the total for the table will correctly reflect the number of students at the university (provided you didn't use record selection). However, the number of students majoring in any given field may be under-reported, because students who declared the program as their second major will only be counted toward their primary program. If you run the same table with duplication enabled, you will get accurate counts of the number of students in each particular major, but the total for the table will be higher than the actual number of students at the university.
The decision of whether to enable duplication is substantive, based on your needs. If you want each student (or faculty member, course section, or degree) to be counted only once and you want the totals to be easier to interpret, avoid duplication. On the other hand, if you want to be certain to count every instance of a characteristic and aren't worried about the values in the totals, then you should use duplication.
It is only possible to enable duplication for one variable at a time. When you enable duplication for a variable, it is automatically disabled for any other variable. You will receive an alert if the table generator disables a prior setting in this way.
It is only possible to enable duplication when the variables are specified as column, row, or page variables. Once the variable pod is in a column, row, or page slot, click on it to open the options menu, then choose "Allow duplication for [students] with multiple values".
The following Table Generator variables can have duplication enabled.
|
|
|
|
Table options
The Table Options area at the left side of the Table Generator screen contains controls to access this help page, control the table format, save or restore a pre-defined table layout, submit your table request, or reset all parameters to their initial values. The Section Table generator also allows users to specify how cross-listed courses should be tabulated.
Excel output
You can request your Table Generator output in HTML form (which will appear in your browser), or as an Excel
spreadsheet. The only substantive difference between the two is that HTML output has the variable labels hyperlinked
to their data dictionary entries. In fact, both forms of output are actually constructed in HTML -- the "Excel"
versions are just presented to your browser in a form that induces it to send the file to Excel for opening. Your
browser will probably ask whether you want to open the file or save it -- open it. Then Excel will typically issue a
warning that looks like this:
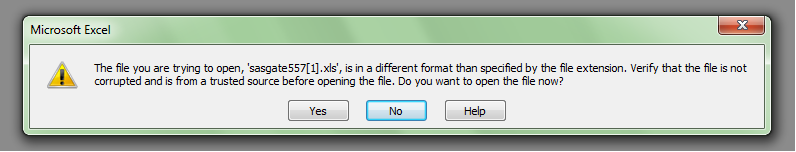
Select "Yes" to open the file. There is nothing harmful in it!
Storing table layouts
If you have a Table Generator request that you make repeatedly, you can save the specification to reuse later. Once you have made the specification, click the "Save Layout" button. You will be prompted to give it a name. Choose something that will help you identify it later, then click "OK". Note that only about 30 characters will show up in the selection list.
Stored layouts write the table specification to a tiny cookie on your computer. This has a couple noteworthy implications. First, you are saving the description of the table, not the table itself. Second, the save layout is only available on the computer on which it was created. If you get a new computer, you'll need to recreate your saved layouts.
Restoring saved layouts
Saved layouts are listed in a drop-down menu right above the "Submit" button. The list is pre-populated with some general-interest layouts that are available to all users. Layouts that you have created personally will appear below the prefabricated ones, in the order that you created them.
Remember that layouts that are with an explicit term specified will be restored with that specification. If you intend to re-use the table to acquire updated data over time, you should use the "Most Recent Term" (or year) selection in the records selection window rather than a specific term.
Managing saved layouts
If you have saved layouts that you created on your computer, you can rename or remove them. To do so, choose "Manage
stored layouts" from the layout selection list. (It should be at the very bottom, below the prefabricated layouts
and any that you've created. It won't appear on the list if you don't have any saved layouts.) The Manage Stored
Layouts window will look similar to the following:
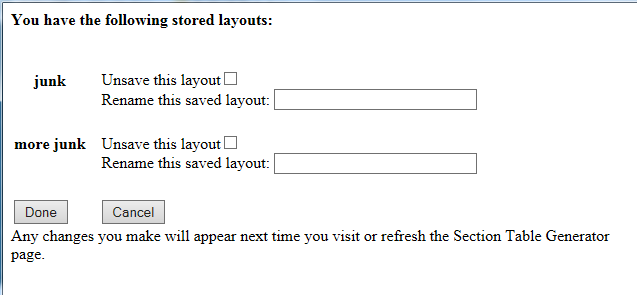
You can delete or rename any of your layouts, then choose "Done" to save your changes. You can click "Cancel" to
exit without making changes. If you do save your changes, they won't be apparent on the Table Generator screen until
you refresh the page.
Data Dictionary:
Following is a list of data elements available in the Section Table Generator.
Term
The semester in which the section was offered. For terms which have had an official census, data reflect status as of the census date for that particular term. Otherwise data reflect status as of the date reported in the Record Selection Criteria table.Use of census data avoids the ambiguities that result from reporting directly from a constantly changing database. Results of table generator queries are stable for terms with census data -- you will get the same results today as you got yesterday if you use the same parameters. A downside to the use of census data is that data that are incomplete or incorrect when they are captured are not changed to reflect subsequent improvements.
Provisional data for upcoming or ongoing semesters is provided in response to user demand, but please bear in mind that data are in flux. Updates are captured weekly (on Monday morning), and may result in transitory results (if you request the same parameters next week, you may not get the same tabular results).
Unlike other table generator variables, there is no "all" selection criterion for Term. By default, the most recent academic term for which census data exist will be selected.
Back to variable list
College
This is the college (within GVSU) responsible for the course offering. At present, all offerings are assigned to the post-reorganization college that is responsible for the course. There is currently no way to use the Section Table Generator to summarize data according to the organizational structure that existed prior to 2004.The extant values for College are:
- COLLEGE OF COMMUNITY AND PUBLIC SERVICES
- COLLEGE OF HEALTH PROFESSIONS
- COLLEGE OF LIBERAL ARTS AND SCIENCES
- COLLEGE OF EDUCATION
- UNIVERSITY-WIDE INTERDISCIPLINARY INITS
- KIRKHOF COLLEGE OF NURSING
- PADNOS COLLEGE OF ENGIN. AND COMPUTING
- SEIDMAN COLLEGE OF BUSINESS
Back to variable list
Department
This is the academic department responsible for the course offering. This may be different from the instructor's assigned department (see Instructor Department below). This also differs from the Course Prefix in some cases, since several academic departments offer courses in more than one content area with different prefixes -- e.g. CBR (Broadcasting) and CPH (Photography) courses are both offered (among others) by the School of Communications.Back to variable list
Course Prefix
This is the first 3 letters in the course or section ID, representing the general content area of the course. Note that multiple prefixes / content areas can be offered by a single Department.EXAMPLE: the prefix for PLS 211 A is PLS
Back to variable list
Course Level
This is a broad categorization of the course call number, representing the approximate level of difficulty or sophistication of the course. Courses with higher levels are presumed to be more advanced than those at lower levels. There are three possible levels of aggregation for Course Level. The following table summarizes those levels of aggregation and the associated categories of courses:| By 100's (default) | 000-Level |
|---|---|
| 100-Level | |
| 200-Level | |
| 300-Level | |
| 400-Level | |
| 500-Level | |
| 600-Level | |
| 3 categories | Lower-Division (000-299) |
| Upper-Division (300-499) | |
| Graduate (500-699) | |
| 2 categories | Undergraduate |
| Graduate |
Back to variable list
Course ID
This is the 7-character course ID. The numeric potion of the course ID should always start in the 5th position (e.g. "NUR 400", not "NUR400" and "ED 330", not "ED330" or "ED 330"). This distinction is only important for you if you use Course ID for record selection (see Record Selection above).There are three formatting options available for Course ID: ID only ("CHM 115") [default]; title only ("Principles of Chemistry"); or both ("CHM 115 - Principles of Chemistry").
Back to variable list
Section ID
This is the full ID of the section, including the prefix, course number, and section code. Combined with Term, the section ID uniquely identifies a course section. As with Course ID above, the presence of spaces is important: the numeric portion should start in the 5th position and the section code should start in the 9th position. Most section IDs are either 9 or 10 characters long, depending whether they have a one-character or a two-character section code. These distinctions are only important for you if you use Course ID for record selection (see Record Selection above).EXAMPLES: WRT 305 H; BIO 205 A1; MKT 655 A
Back to variable list
Instructor Rank
The rank and appointment type of the primary faculty member assigned to teach the section. Faculty with regular appointments are categorized by rank, while all others are categorized by type of appointment (i.e. adjunct, affiliate, or visitor). Sections without assigned instructors ("Staff" sections) are counted under "Adjunct". Please note that faculty rank data from semesters prior to fall 2004 are somewhat tenuous. Subsequent data should be much more reliable. There are two levels of aggregation available for reporting Instructor Rank. The default is to show the levels in relative detail, while the alternative groups faculty by appointment type as follows:| Default | Alternative |
|---|---|
| Adjunct Professor | Adjunct |
| Visiting Professor | FT Non-Tenure-Track |
| Affiliate Professor | |
| Instructor | Tenured / Tenure-track |
| Assistant Professor | |
| Associate Professor | |
| Professor |
An instructor's rank is determined once per year, on September 30th. For the most part, this yields accurate data for semesters that are over or in-progress, because faculty appointments typically run August through August. Note however that rank data for upcoming semesters are approximate only, since promotions and changes in appointments that occurred or will occur after the last Sep 30 census will not be reflected.
Back to variable list
Instructor Department
This is the academic department in which the primary assigned instructor has his or her principal assignment. This may be different from Department, the department responsible for the course. Sections without assigned instructors ("Staff" sections) are assigned to the course's department. An instructor's home department is determined once per year, on September 30th. For the most part, this yields accurate data for semesters that are over or in-progress, because faculty appointments typically run August through August. Note however that Instructor Department data for upcoming semesters are approximate only, since changes in appointments that occurred or will occur after the last Sep 30 census will not be reflected.Back to variable list
Instructor
The instructor assigned to the section in the university's SIS or Banner records. Despite insistence by the Records office that all sections have their instructors attributed correctly, there are still some sections assigned to "STAFF." Since Table Generator data are reflective of data as they exist on the census date for the term (generally 1 week into classes), they are not corrected retroactively -- if a section appears as staff and you know who the real instructor was, it's too late to fix the table generator data, but please encourage department and college administration and staff to submit correct and timely information for future terms.
Names are formatted LAST, FIRST.
Back to variable list
Section Location
The GVSU campus on which the course was offered. Note that distance education sections often require one or more "face-to-face" meetings, in which case, the course is categorized according to the location of those meetings. Sections without scheduled meetings are generally counted as if they occur at Allendale. Courses of those types can be distinguished by using Contact Type.Extant values are:
- ALLENDALE CAMPUS
- GRAND RAPIDS CAMPUS
- MUSKEGON
- OTHER GRAND RAPIDS LOCATIONS
- HOLLAND
- OUT OF COUNTRY
- OTHER MICHIGAN LOCATIONS
- TRAVERSE CITY
- OUT OF STATE
Back to variable list
Building
The building in which the section meets. Buildings are listed by both the building code and name (e.g. "CAC Calder Art Center"). Sections with more than one meeting place scheduled are categorized in the building containing their primary meeting space (the one listed first). A list of extant values can be viewed by opening the Record Selection window from the pod options window.Back to variable list
Night / Weekend
Sections with scheduled meeting times beginning at 6:00 PM or later are considered evening courses. Any sections with scheduled meetings on Saturday or Sunday are labeled as "weekend courses". Any sections that meet both of these criteria, and are labeled "Both".Back to variable list
Instruction Type
This the instructional activity type recorded for the section in SIS. Extant values are:- CLINICAL STDY
- DISCUSSION *
- FIELD STUDY
- INDEP STUDY
- INTERNSHIP
- INDEP READING
- INTL STUDIES
- LABORATORY *
- LEC-DISC *
- LECTURE *
- LEC & LAB *
- PRACTICUM
- RESEARCH
- REHEARSAL *
- SEMINAR *
- STUDIO *
Back to variable list
Gen-Ed - Foundations
Indicates any GVSU General Education Foundations category to which the section can be applied. The categories are:- THE ARTS
- PHILOSOPHY AND LITERATURE
- HISTORICAL ANALYSIS (formerly HISTORICAL PERSPECTIVES)
- MATHEMATICAL SCIENCES
- PHYSICAL SCIENCES
- LIFE SCIENCES
- SOCIAL & BEHAVIORAL SCIENCES
Back to variable list
Gen-Ed - Cultural
Indicates any GVSU General Education Cultural Emphasis category to which the section can be applied. The categories are:- GLOBAL PERSPECTIVES (formerly WORLD PERSPECTIVES)
- US DIVERSITY
Back to variable list
Gen-Ed - Themes
Indicates any GVSU General Education Theme to which a course can be applied. The themes are:- CHANGING IDEAS: CHANGING WORLDS
- EARTH AND ENVIRONMENT
- ETHICS
- FREEDOM AND SOCIAL CONTROL
- GENDER, SOCIETY AND CULTURE
- MAKING WAR AND PEACE
- PERSPECTIVES FROM THE OUTSIDE
- RELIGION
- REVOLUTION AND EVOLUTION IN THE AMERICAS
- SOCIETY AND MEDIA
- THE HUMAN JOURNEY
- THE U.S. CIVIL RIGHTS MOVEMENT
- DEATH AND DYING
- GLOBAL CHANGE: INTEGR. AND FRAG.
- HEALTH, ILLNESS, AND HEALING
- CITIES
- CREATIVITY: IDEAS & INNOVATION
- PERCEPTION
- THE AMERICAN MOSAIC
- DEMOCRACY
- SPORT & LIFE
Back to variable list
Gen-Ed - Themes
Indicates any GVSU General Education Issues category to which a course can be applied. The Issues requirement was first implemented in Fall 2013, so all values prior to that semester are listed as "No Category". The categories are:- Globalization
- Health
- Human Rights
- Identity
- Information, Innovation, and Technology
- Sustainability
Back to variable list
SWS
Indicates whether a section satisfies the General Education "Supplemental Writing Skills" requirement.Back to variable list
Contact Type
Indicates the nature of instructor-student contact for the course:- Hybrid - course has limited in-person meetings with remainder of instruction occuring online
- Online
- Scheduled - Course has regular meetings in which instructor and students meet in a shared physical space. See Instruction Type for a list of the specific meeting types that are included.
- Other - Includes unstructured course types such as Independent Study, Internships, and Research.
Back to variable list
Number of Seats
The maximum enrollment allowed for the section. When used as a data variable, aggregation will be the sum across any applicable sections. The default formatting when used as a categorical (i.e. row, column, or page) variable is by10at0 -- [0-9,10-19,20-29,...]. You can modify the formatting using the variable formatting window.Back to variable list
Student Credit Hours
The total student credit hours (i.e. number of students times number of credit hours per student) generated by the section. Data reflect official census enrollment or enrollment as of the date specified in the Record Selection Summary table. Any drops/adds that occur after the census are not reflected in Table Generator data. When used as a data variable, aggregation will be the sum across any applicable sections. The default formatting when used as a categorical (i.e. row, column, or page) variable is by10at0 -- [0-9,10-19,20-29,...]. You can modify the formatting using the variable formatting window.Back to variable list
Scheduled Hours
The number of credit hours awarded to any single student upon completion of the section. When used as a data variable, aggregation will be the sum across any applicable sections. The default formatting when used as a categorical (i.e. row, column, or page) variable is by1at0 -- [0,1,2,3,...]. You can modify the formatting using the variable formatting window.See also Contact Hours
By default, non-credit sections are excluded from Section Table Generator tables. You can clear this selection criterion by selecting the appropriate option from the options window, or specify an alternative criterion in the record selection window.
Back to variable list
Enrollment
The number of enrolled students on the census date for the term or the date specified in the Record Selection Summary table. Any drops/adds that occur after the census are not reflected in Table Generator data. When used as a data variable, aggregation will be the sum across any applicable sections. The default formatting when used as a categorical (i.e. row, column, or page) variable is by5at0 -- [0-4,5-9,10-14,...]. You can modify the formatting using the variable formatting window.Back to variable list
Number of Sections
The number of sections that meet the given criteria. This is the default data variable for Section Table Generator tables.Back to variable list
Data Variables
This pod is a placeholder that controls how the multiple data variables will be dispayed in your table. You can move it around in your table (to other "Column", "Row", or "Page" slots), but the only way to remove it from the table is to remove "Data" variables until only one "Data" slot is occupied, at which time the Data Variables pod will disappear. The Data Variables pod will initially be placed in an empty "Column", "Row", or "Page" slot if possible. If all of those slots are filled, Data Variables will displace the pod in the second "Column" slot.Back to variable list